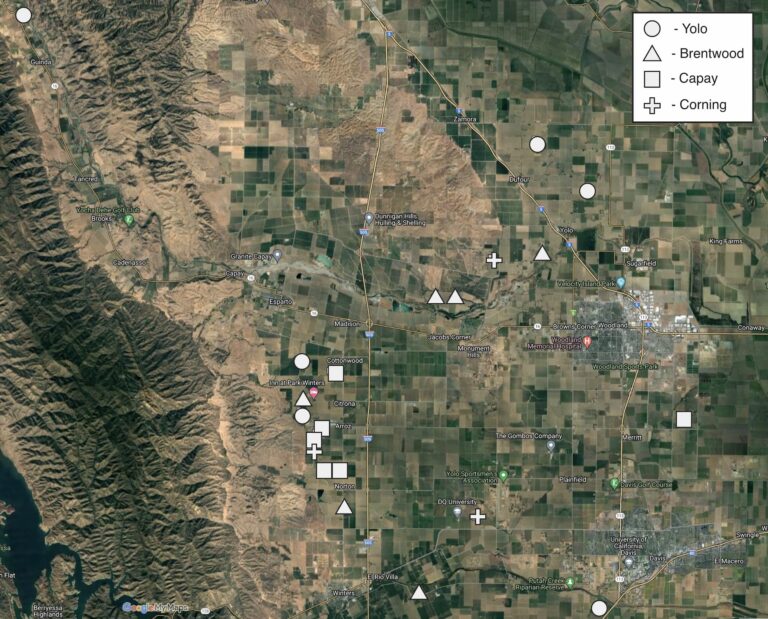
Figure 1. Map of 21 sampling locations across Yolo County, California; designated by soil series, including Yolo silt loam (n=6), Brentwood clay loam (n=6), Capay silty clay (n=6), and Corning loam (n=3).
Sampling Design
Using a historical planting of hedgerows established in the mid-1990s, we assessed the impact of afforestation on commonly used soil health indicators (0-20 cm) and soil carbon (0-100 cm) across four soil types in Yolo County, CA. To characterize differences between hedgerows and adjacent cultivated fields, we analyzed a broad suite of lab-based and in-field biological, chemical, and physical indicators commonly proposed to underpin soil health and function.
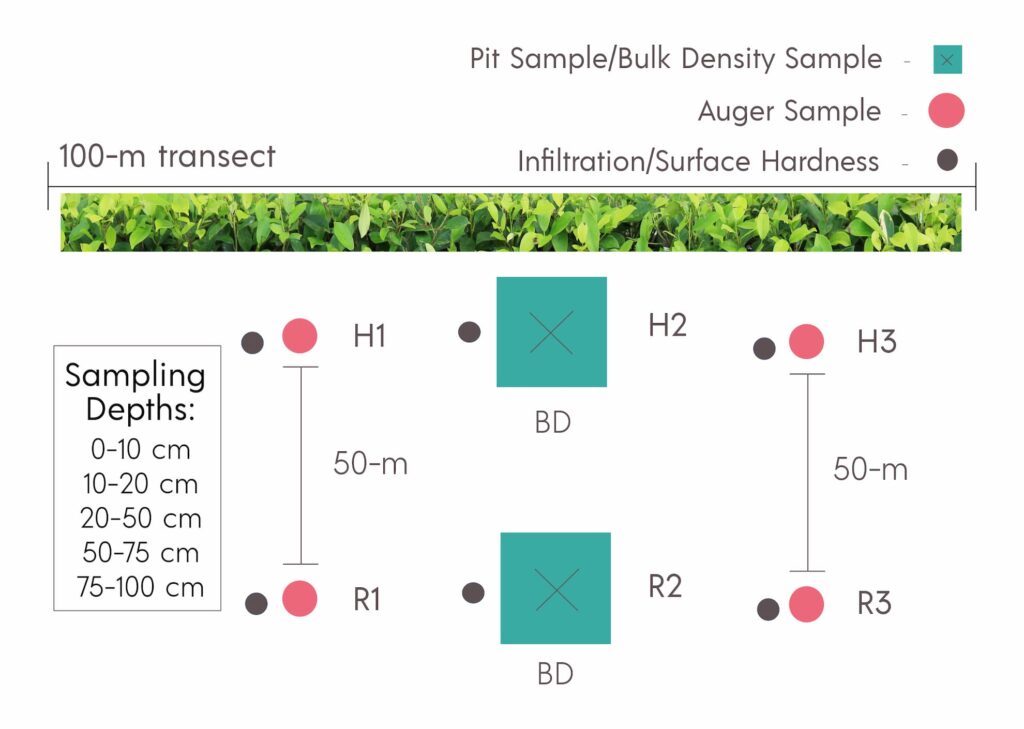
Figure 2. Sampling design for measuring soil properties and in-field indicators across a 100-m transect in hedgerows and 50-m away in adjacent cultivated fields.
Site Information
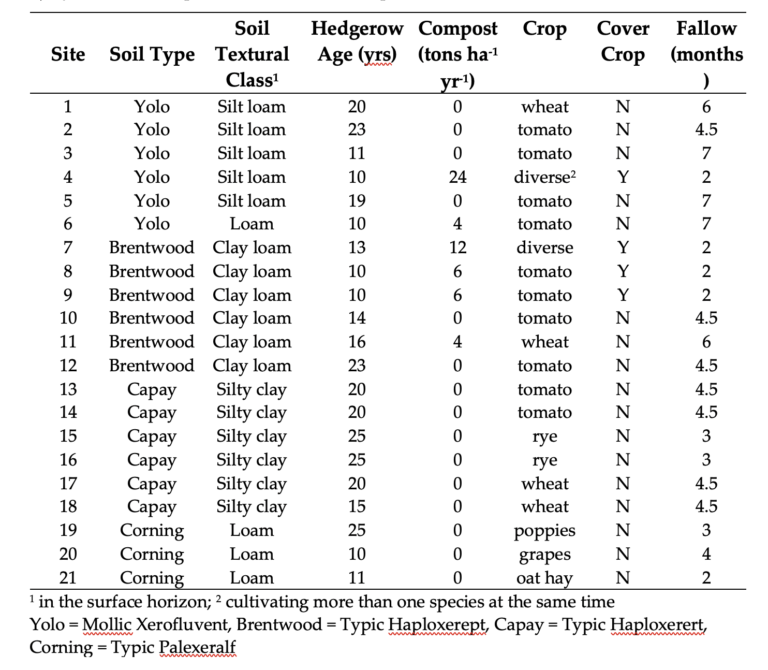
Table 1. Site information for 21 hedgerows and adjacent cultivated fields in Yolo County, California. Compost, cover crop, and fallow represent the typical management (in cultivated fields) for the past five years, while crop refers to the current crop in the rotation.
Soil Profiles
Previous slide
Next slide
Figure 3. Side-by-side photographs of soil pits in hedgerows and adjacent cultivated fields at each of 21 farm sites.
Methods
Collected samples to 1 meter from 3 randomly selected locations across a 100-m transect within the hedgerows and 3 locations, 50 meters away in adjacent cultivated fields. Sieved surface soils to <8mm, subsampled to <2mm, & air-dried both. Sieved subsurface soils to <2mm & air-dried. Ball milled all <2mm subsamples for dry combustion (soil carbon/ nitrogen). Shipped samples for biological analysis overnight on dry ice to University of Illinois. Bulk density samples were oven-dried at 105C until weight did not change. The following analyses were performed:
Total Carbon/Nitrogen – Costech Elemental Analyzer
The following in-field, performance indicators were also assessed at all 3 locations:
Infiltration Rate – Double Ring Infiltrometer
(Sub)Surface Hardness – Penetrometer
Whole Profile Carbon Stocks
Figure 4. Mean soil carbon stocks by soil type (1-m depth) in hedgerows and adjacent cultivated fields (Two-way ANOVA). One-way ANOVA refers to soil carbon stocks across sites by hedgerow and cultivated fields. Number at the top of each column indicates the sample mean, bars indicate standard error. Letters indicate significant differences between soil types (n=6, except Corning n=3) and asterisks indicate significant differences by hedgerow (n=21) and cultivated fields (n=21) in Tukey means comparisons at P < 0.05.
Soil Health Metrics
Table 2. Mean and standard error values for measured soil health variables at 0-10 cm and 10-20 cm depths by management type (hedgerow and cultivated fields). Two-way ANOVA results are listed for each depth by management type, soil type, and their interactions. Asterisks indicate significant differences at * = P< 0.05, ** = P< 0.01 ,*** = P< 0.001.
Principle Component Analysis
Figure 5. PCA ordination biplot of the 20 sites, classified by 4 soil types. Vectors represent soil health variables and soil physical properties at a) 0-10 cm and b) 10-20 cm depths. Values in parentheses on x- and y- axes labels represent the variation in data explained by each principal component. EOC, extractable organic carbon; EON, extractable organic nitrogen; MBC, microbial biomass carbon; MBN, microbial biomass nitrogen; POXc, permanganate oxidizable carbon; BG, β-glucosidase; NAG, β-glucosaminidase; CEL, cellulase; GWC, gravimetric water content.
Main Takeaways
Soil C was higher in the upper 100 cm under hedgerows (14.4 kg m-2) relative to cultivated fields (10.6 kg m-2) and at all depths (0-10, 10-20, 20-50, 50-75, and 75-100 cm). The difference in soil C (3.8 kg m-2) did not vary by soil type, suggesting a broad potential for hedgerows to increase soil C stocks. At 0-10 cm, soil C, available C, MBC and MBN, enzyme potential activity, and aggregate stability were two times higher under hedgerows, relative to adjacent cropland, while infiltration rates were at least two times faster. At 10-20 cm, only soil C, MBC, C-cycling enzymes, and surface hardness were higher under hedgerows. While some metrics were more sensitive than others (i.e. total C, MBC, MWD), a composite of biological, chemical, and physical indicators was necessary to explain the variation in the data.
Adoption Scenario
Table 3. Estimated state-wide potential of hedgerows established along farm edges to contribute towards California’s annual GHG reduction goals.
Co-Benefits of Hedgerows
Figure 6. Conceptual diagram of expected soil health processes observed in field edge plantings compared to bare field edges.


")